Richmond Prices
Use Caution
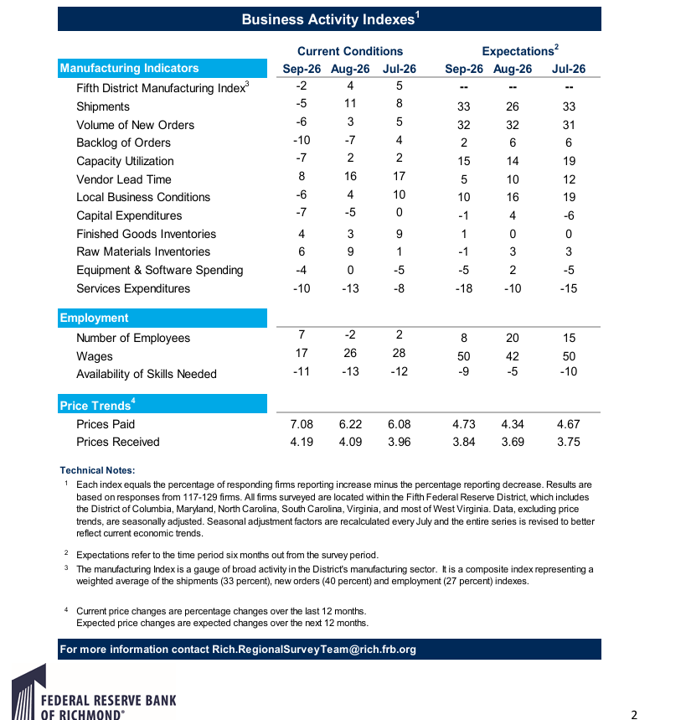
BE CAREFUL when interpreting this report. Almost all of these series are diffusion indices, but NOT prices.
Check out footnote 4. These are price changes over 12 months; LTM for the “Current” and NTM for the “Expected”.
So, 7.08 is a 7.08% change in prices over the last twelve months (LTM).
Pricing Power
The survey collects prices paid and received and reports the average (which I assume is the simple mean and not trimmed).
In some ways, the difference between prices paid and received gives a hint about profit margins.
Of course, we need to use caution. A simple average can bias the interpretation for myriad reasons (e.g. this is not a firm-level matching, there are no quantity or cost shares, missing wages, etc..).
But, we can can still glean some information if we are careful.
In the following I computed DeMeaned Prices Recievied Minus DeMeaned Prices Paid. The DeMeaning was off of a 12mth rolling window.
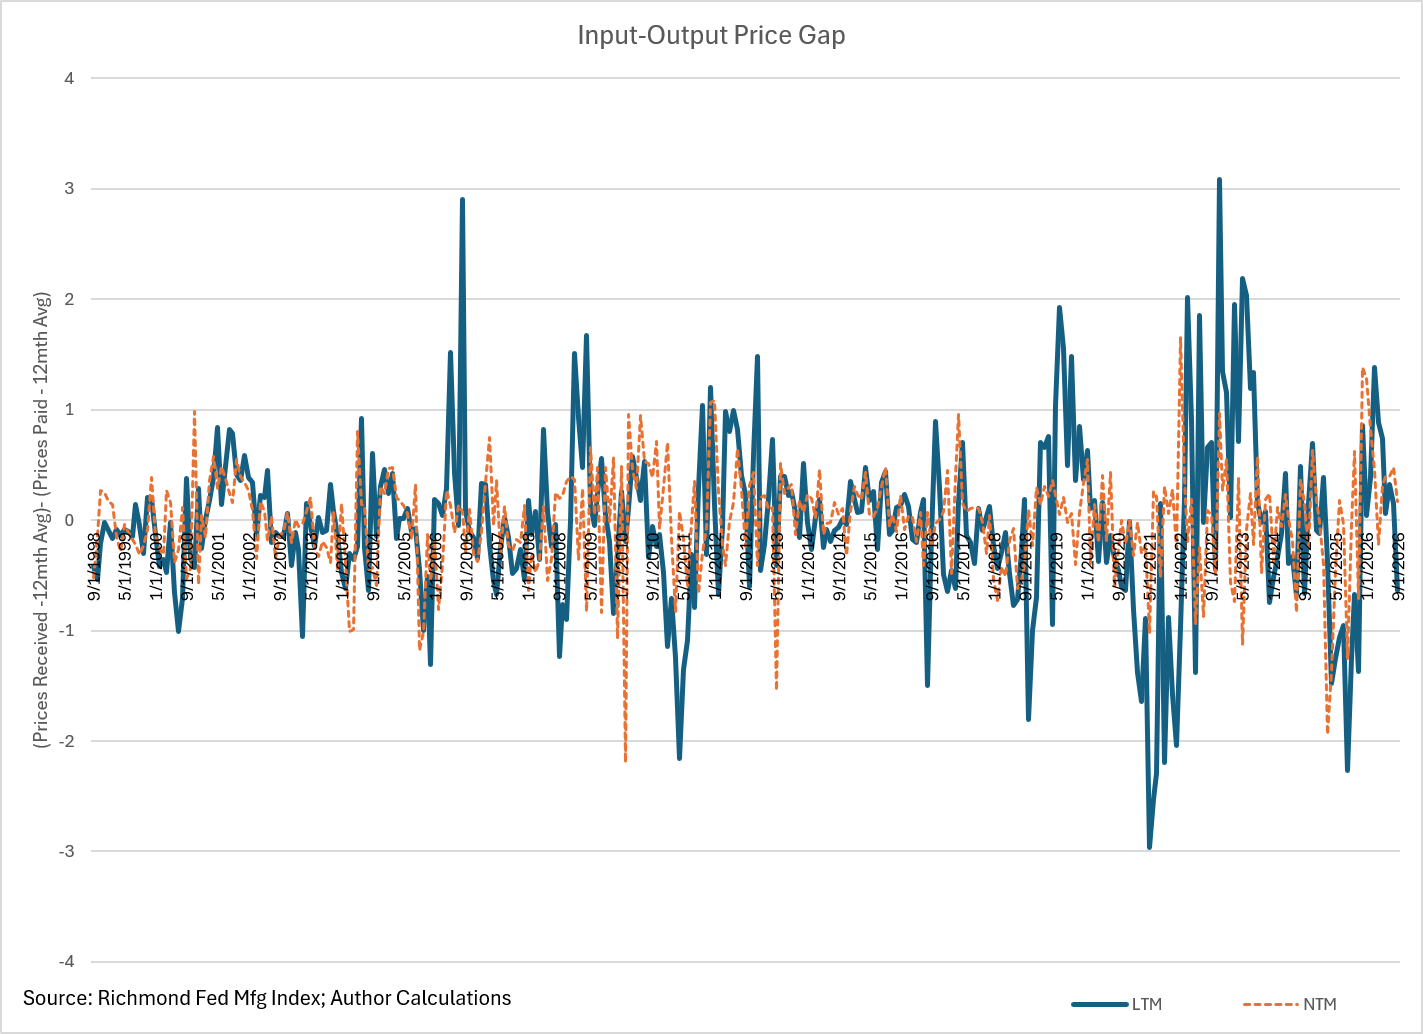
Orange is NTM and Blue LTM.
If the line is positive(negative) then output price growth exceeds input price growth by more(less) than usual.
Both lines have just dropped into negative territory; i.e. input prices rising faster than output. Not good for margins.
How did it manifest?
Dig a bit deeper. That gap could be dropping because prices received are falling and/or prices paid are rising.
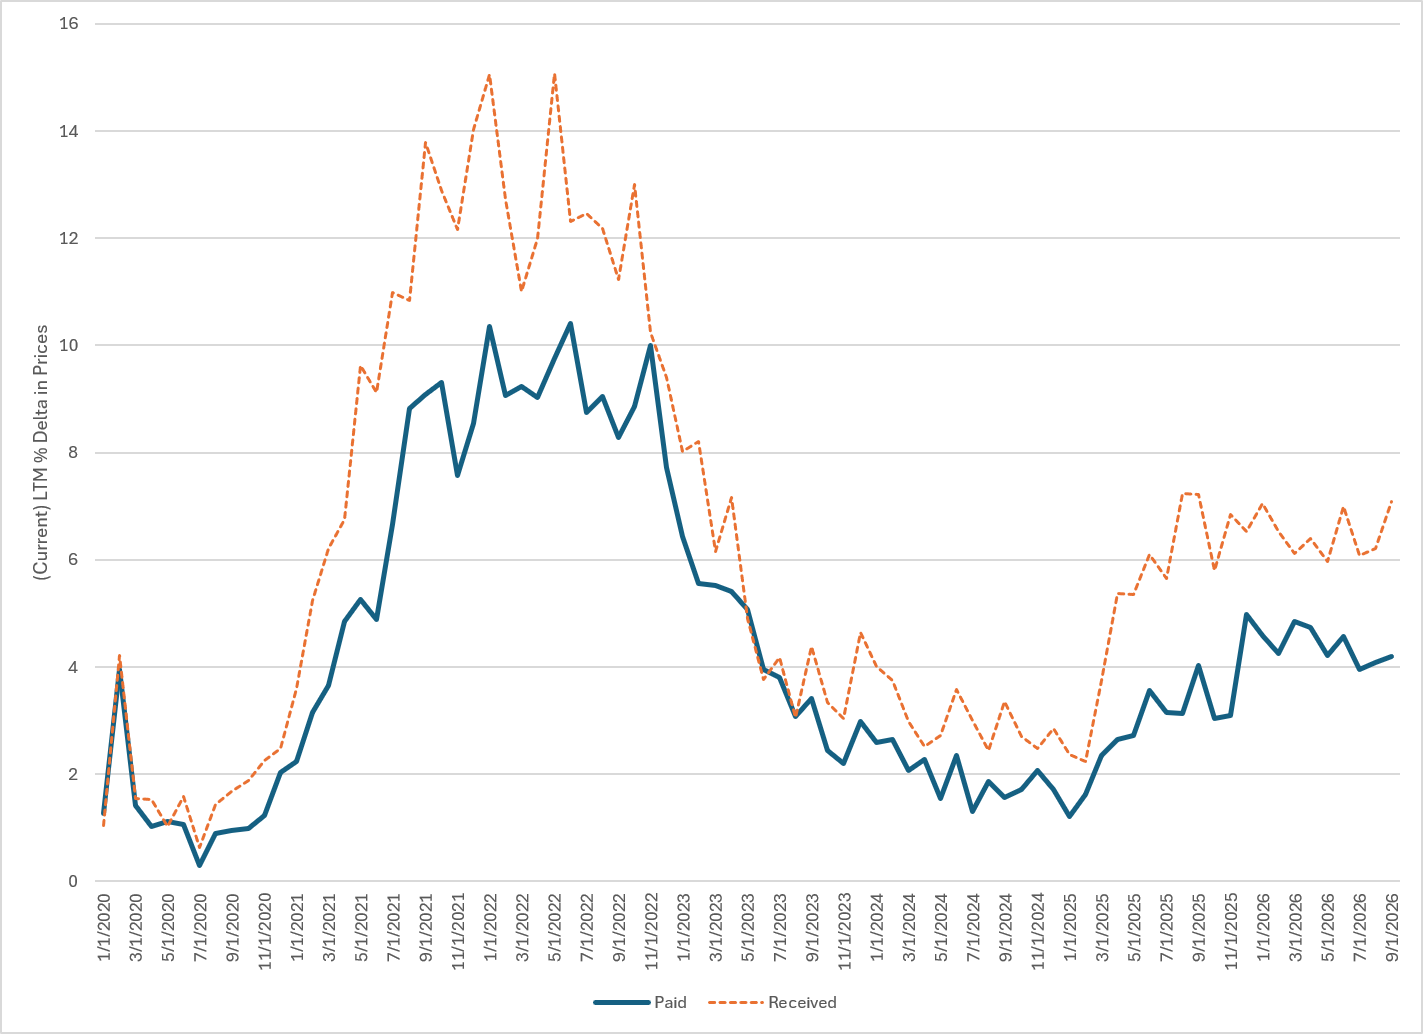
As you can see, the latest move was because of prices paid rising, while output prices are flat.
Services
I repeated the exercise for the Richmond Fed’s non mfg (services) index.
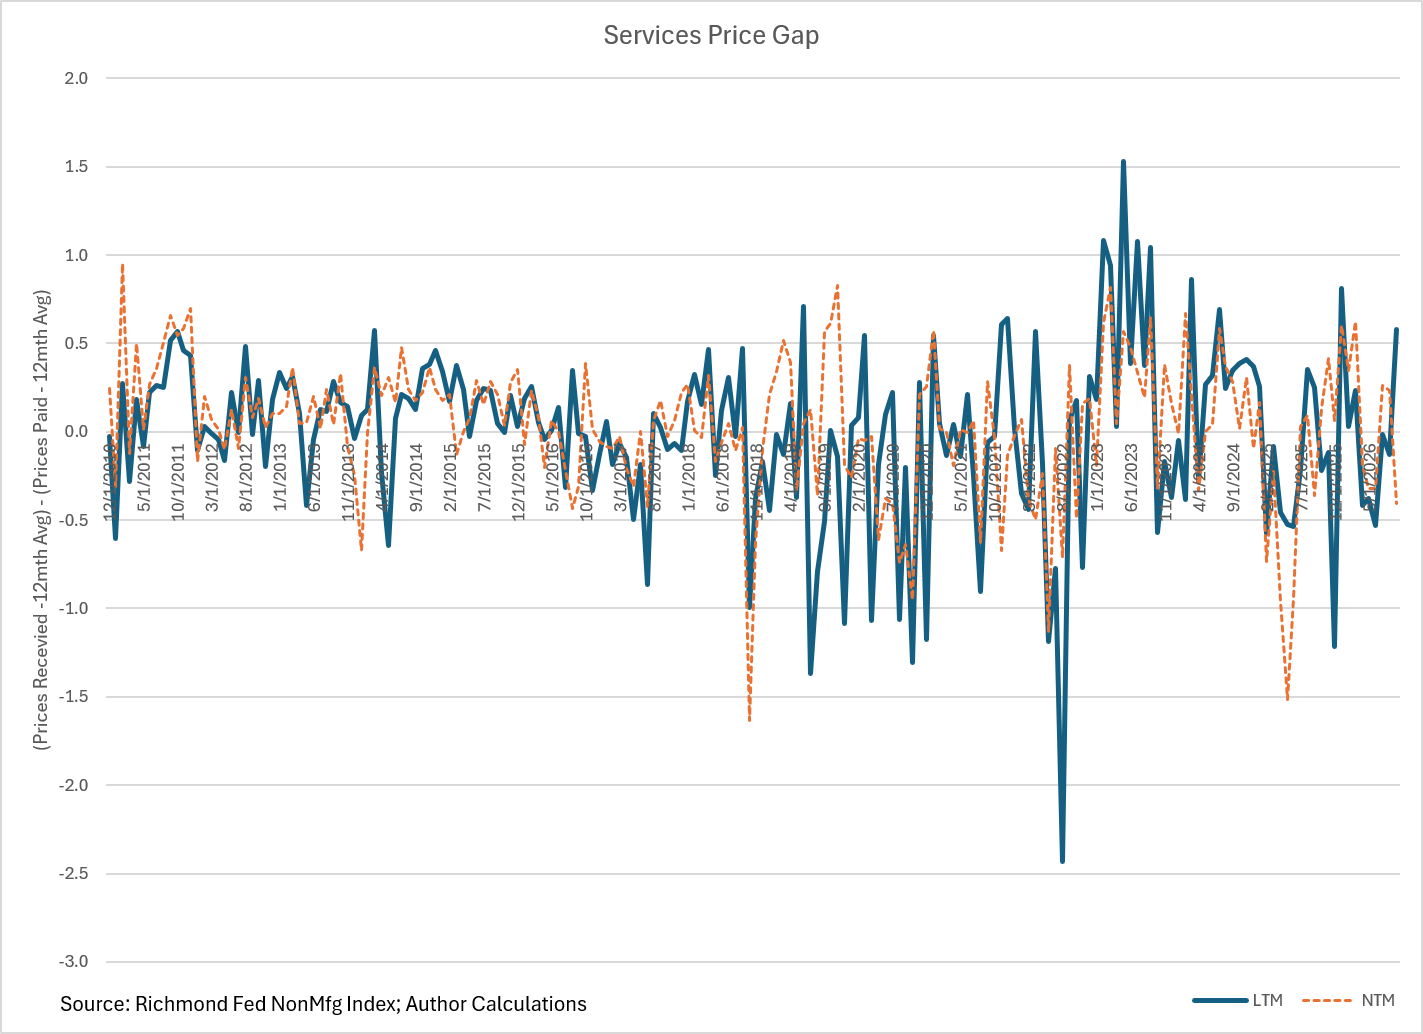
NTM tells a similar story of the potential for a margin squeeze.
However, services businesses appear to have output price growth exceeding input price growth by more than usual.